The pitch is everywhere. Cancel cable, switch to streaming, save hundreds of dollars a year. Sometimes that math works out. Often it works out to less than advertised. For a meaningful minority of households, the switch actually costs more once everything gets added up.
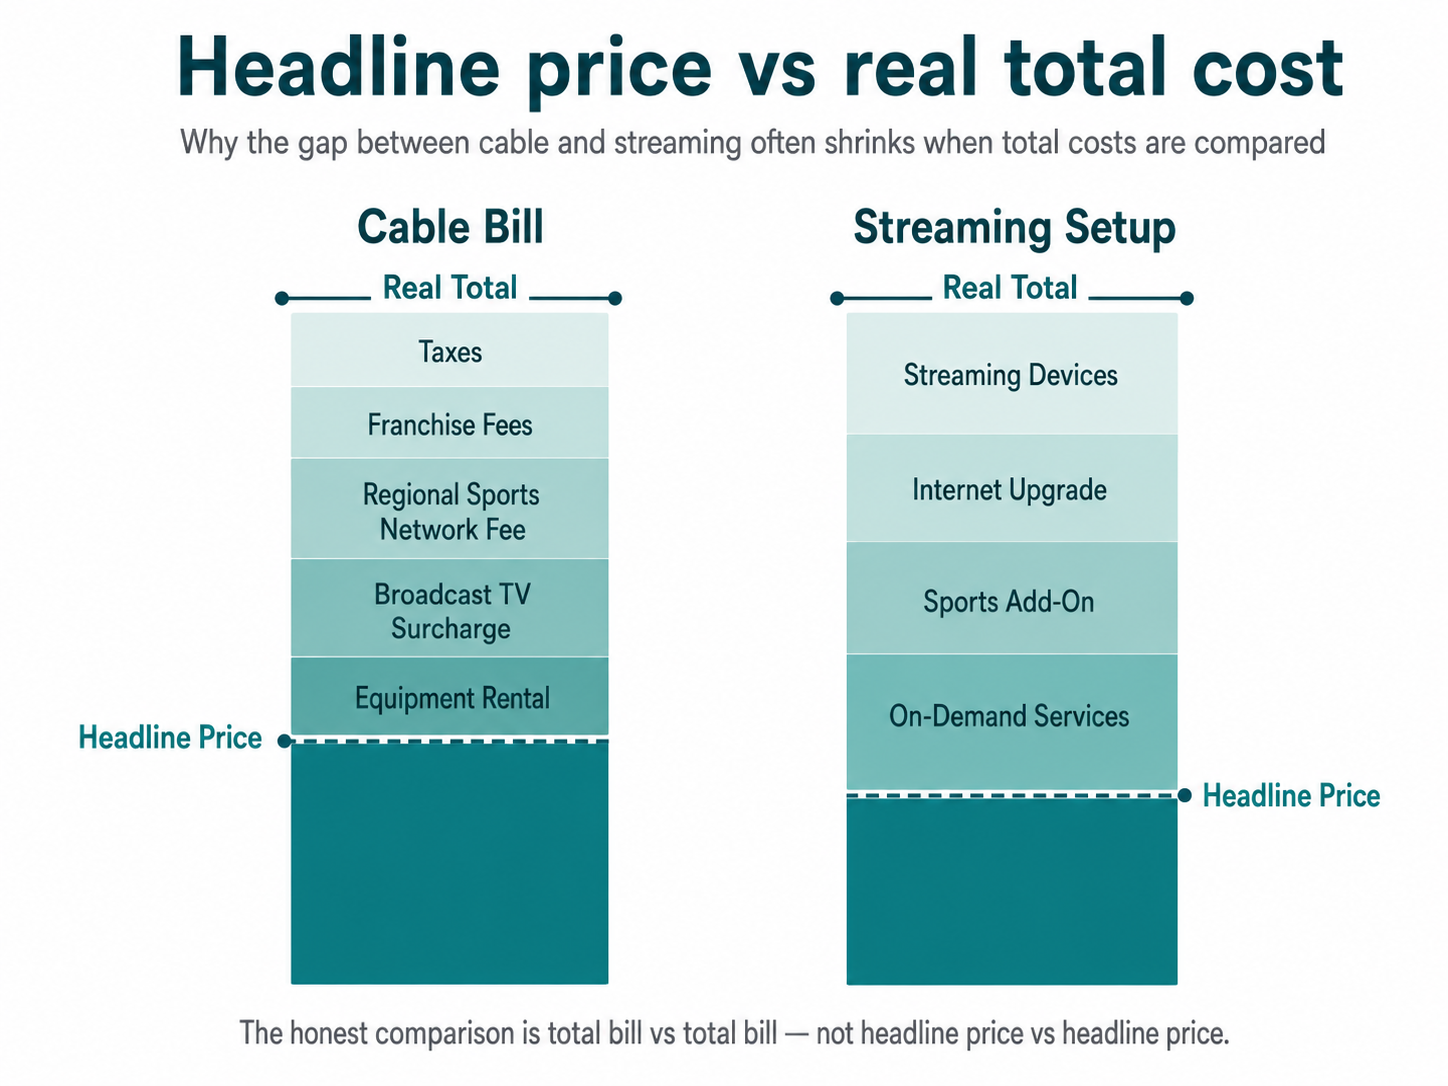
The reason these articles disagree so wildly is that most of them compare the wrong numbers. They put a cable headline price against a streaming headline price and call that the answer. The honest comparison is total bill against total bill, and that comparison looks very different.
Cable fees, streaming prices, internet bundles, sports add-ons, and promotional offers change often. This guide explains the cost structure rather than current pricing, and readers should verify current numbers with their provider and streaming services before deciding.
Quick Reference: Likely Cost Outcome by Household Type
| Household profile | Likely outcome after switching |
|---|---|
| Sports-light, one or two TVs, standalone internet | Meaningful savings |
| Already pays for streaming services they would keep anyway | Modest to meaningful savings |
| Multi-TV household on a bundled cable-and-internet plan | Small savings or break-even |
| Follows a specific RSN team, multiple TVs, several streams | Break-even or higher cost |
| Watches heavy premium movie content across several services | Often higher cost than cable |
The rest of this article explains why these outcomes hold and how to run the math for a specific household.
What Cord-Cutting Actually Means
Cord-cutting is not just canceling cable. It is replacing the function cable served with some combination of other services. Usually that means one or two live TV streaming subscriptions, a couple of on-demand services, possibly an antenna for local channels, and a fast enough internet connection to run all of it reliably.
The point matters because the savings calculation only makes sense when the replacement setup is honestly accounted for. A household that cancels cable and then subscribes to a live TV streaming service, two on-demand apps, and a sports add-on has not really cut anything. It has switched providers.
The Headline Math Most Comparisons Use
The standard cord-cutting article runs the math like this. A typical comparison might say cable is $120 a month and a live TV streaming service is $75, so the household saves $45 a month, or $540 a year. That example is useful as a starting point, but it is not the full calculation.
That comparison has two problems. The cable number is the headline price, not the bill. The streaming number is the subscription price, not the total cost of replacing cable. Both numbers are wrong in directions that make the savings look bigger than they are.
The Honest Math
A real cable bill is rarely the headline price. It includes equipment rental for the box, a broadcast TV surcharge, regional sports network fees in markets where those fees apply, franchise fees, and taxes. Depending on the market and the package, the total bill can run noticeably above the headline number. A package advertised around $99, for example, can cost considerably more once equipment, broadcast fees, sports fees, and taxes are added.
The replacement setup has its own real costs. The live TV streaming subscription is the headline number, but most households add at least one on-demand service to recover the catalog cable provided. Households that follow sports often need a sports add-on or a second service to recover the regional sports network coverage cable included. Internet speed may need to increase to handle streaming reliably across multiple TVs. Equipment costs for streaming devices, while smaller than cable box rental, are not zero.
When the total cable bill is compared to the total replacement bill, the gap is usually much narrower than the headline comparison suggests. Sometimes it disappears entirely.
When Cord-Cutting Saves Real Money
The savings are real and meaningful for certain household profiles.
Households that do not follow sports closely tend to save the most. The regional sports network surcharge on cable is one of the largest line items, and cutting it cleanly removes a significant cost. If nobody in the household needs a specific local team’s games, the streaming replacement can skip the sports add-on entirely.
Households that already pay for streaming services they intend to keep also save more, because those subscriptions are sunk costs whether cable stays or goes. The marginal cost of replacing cable is just the live TV service, not the full streaming bundle.
Households comfortable with a tighter content library save real money too. Cable’s value proposition partly rests on having a lot of channels available even if most go unwatched. A household willing to live with fewer options can pick a smaller streaming plan and skip the catalog-replacement services.
Single-viewer households or households with one or two TVs also tend to save more, because they do not need premium plans that support many simultaneous streams.
When Cord-Cutting Saves Little or Nothing
Other household profiles see modest savings, break-even outcomes, or sometimes higher monthly costs after the switch.
Households that follow a specific regional sports network team face the steepest replacement cost. Recovering that coverage through streaming usually requires either a premium tier of a live TV service or a separate sports subscription, often both. Once that is added, the savings shrink considerably.
Households with multiple TVs and several simultaneous viewers need higher-tier streaming plans, and those plans price closer to cable than the entry-level tiers. The headline savings comparison usually assumes the cheapest streaming plan, which does not match a four-TV household’s actual needs.
Households that watch a lot of premium movie content end up subscribing to multiple on-demand services to recreate what cable’s premium tier offered as a bundle. The stacking effect adds up fast.
Households with poor home internet face a harder problem. Streaming requires reliable bandwidth, and an upgrade may be necessary before the switch is even viable. That upgrade cost is part of the honest comparison.
The Internet Cost Trap
This is the cost most cord-cutting articles skip entirely, and it can swing the whole calculation.
Many cable subscribers are on bundled plans where the internet portion of the bill is discounted because TV is included. Canceling cable TV often removes that bundle discount, pushing the standalone internet bill higher. The cable bill goes down, the internet bill goes up, and the net savings shrink.
Separately, streaming requires more bandwidth than most households realize, especially with multiple TVs running simultaneously in 4K. A household that needed a basic internet plan with cable TV may need to upgrade to a faster tier to stream reliably. That upgrade is a real ongoing cost, not a one-time setup.
Anyone running this comparison should pull both their current cable bill and their current internet bill, then check what the standalone internet price would be without the bundle. The difference is part of the honest number.
The Sports Cost Trap
The second cost trap is sports. Cable packages often include regional sports networks in the tiers where local sports coverage is sold, but availability and fees vary by provider and market. Streaming services treat regional sports networks differently. Some carry them, some do not, and the ones that do often charge more for the tier that includes them.
For households that follow a specific local team, the calculation is straightforward: check whether the streaming service available in the market carries the regional sports network for that team, and check the price of the tier that includes it. For households following national sports without a strong local team allegiance, the costs are usually smaller, but national packages still add up across football, basketball, and baseball seasons.
The honest version of this calculation does not assume the household will accept losing access to local team coverage. If the games matter, the cost of recovering them belongs in the comparison.
A Simple Household Cost Checklist
Running the comparison for an individual household takes about ten minutes with a recent cable bill and a calculator.
Current cable side:
- Headline package price
- Equipment rental (per box, per DVR)
- Broadcast TV surcharge
- Regional sports network fee
- Franchise fees and taxes
- Current internet bill with the bundle discount
Replacement streaming side:
- Live TV streaming service for the tier that covers the channels actually watched
- Any on-demand services needed to replace cable’s catalog
- Sports add-on or premium tier if regional sports network coverage matters
- Standalone internet price without the bundle discount, plus any speed upgrade
- One-time cost of streaming devices for each TV, spread over expected lifespan
The number that matters is total replacement monthly cost minus total current monthly cost. Anything else is marketing.
The Honest Answer
For some households, cord-cutting saves meaningful money every month once the switch settles. For others, the savings are smaller than the marketing suggests. For a meaningful minority, the total replacement setup costs the same or slightly more than the cable bill it replaced.
The decision should follow the household’s actual viewing patterns, not a generic comparison. Sports households, multi-TV households, and households with bundled internet face the smallest savings or sometimes none. Sports-light households with simple viewing patterns and standalone internet face the largest.
The Short Version
Most cord-cutting articles compare cable headline prices to streaming headline prices, which is the wrong comparison. The honest comparison is total cable bill against total replacement bill, including the on-demand services, sports add-ons, internet adjustments, and equipment that actually replace what cable provided. Run that math for the specific household. The answer is sometimes a clear win for streaming, sometimes a wash, and sometimes a loss. The marketing answer is always a win, which is why it should not be trusted as the household answer.
Leave a Reply